fbpx

InBody 570 Scan Interpretation Guide

Interpretation Guide for InBody Scan

workout recovery techniques wollongong

This page will give you a detailed briefing about every section of the InBody Scan results sheet.

Ā 

Total body weight alone is not a clear indicator of a person’s overall healthĀ as it does not distinguish the amount of fat or lean body mass in the body.Ā You can use your InBody scan to track various goals, and it is up to you to decide which metrics you wish to focus on for your training.Ā 

Ā 

Below we will go over each metric on the InBody 570 Scan and give a brief explaination of what each metric represents.

InBody 570 Scan Interpretation Guide

Lets Review The Body Scan Datapoints!

InBody 570 Results Interpretation Body Scan Guide

Total Body Water

TBW is all the water in the body and is approximately 60% of your total weight. Ideally, your TBW should be in the normal range or over. Usually, individuals with a higher degree of muscle mass will have higher levels of TBW.

Ā 

Protein
Protein consists of nitrogen, and high nitrogen levels within cells indicate good levels of muscle mass and health. A lack of protein implies a lack of muscle mass is possibly indicating poor nutrition and malnourishment. Protein is directly related to intracellular water. Therefore, a lack of protein suggests a lack of intracellular water, which in turn suggests poor nutrition. Ideally, your protein content should be within or exceed the average range set out below the reading.

Ā 

Minerals
Minerals consist of two types, osseous mineral, and non-osseous minerals. The osseous mineral is bone, where non-osseous minerals are those found in all other parts of the body. Mineral mass is closely related to soft lean mass. If you have more lean mass, the weight of bones strength, which in turn increases the bone mineral.

Ā 

Total Body Water
Displayed in Litres (L). 1L = 1kg

Ā 

Soft Lean Mass
The sum of Your Total Body Water, Protein and Non-Osseous Minerals (calculated by deducting your Bone Mineral Content from the total Minerals).

Ā 

Fat-Free Mass
Is your weight minus your Body Fat Mass (how much you would weight if you had no fat on your body)

Ā 

Weight
The sum of your Total Body Water, Protein, Minerals, and Body Fat Mass.

Muscle Fat Analysis

custom macro meal planner

Weight (kg)
Your overall weight – the only thing you see on the conventional scales

Ā 

SMM (Skeletal Muscle Mass)
This metric show youĀ how much total skeletal muscle mass you have on your body.Ā The body consists of cardiac muscle, visceral muscle, and skeletal muscle. However skeletal muscle can be most transformed through exercise and diet and as such is displayed separately. This number is a good tracking method for those training for muscle gain.

Ā 

Body Fat Mass (kg)
Shows how many kilograms of body fat you have. This number is a good tracking method for weight loss.

InBody 570 Scan Interpretation Guide

Calculated Analysis

f45 training wollongong

Body Mass Index (BMI)
Calculated by use of a formula that divides your weight by the square of your height and does not take into account your overall body composition. A highly muscled individual may be classified as overweight when using the BMI formula which can be misleading. Although BMI is popular as a metric, it can be inaccurate in some cases.

Ā 

Percent Body Fat (PBF)
The percentage of your body fat calculated by the total mass of body fat divided by total body mass.Ā  A good indicator of how lean you are. This metric is usefulĀ for those aiming for weight loss, fitness/physique competitions, body recompositions and overall health status.

Ā 

DescriptionWomenMen
Athletes14ā€“20%6ā€“13%
Fitness21ā€“24%14-17%
Average25ā€“31%18-24%
Obese32% and higher25% and higher

Ā 

CLICK HEREĀ to see some visual examples

Ā 

Body Fat Range Photos
For Men and Women

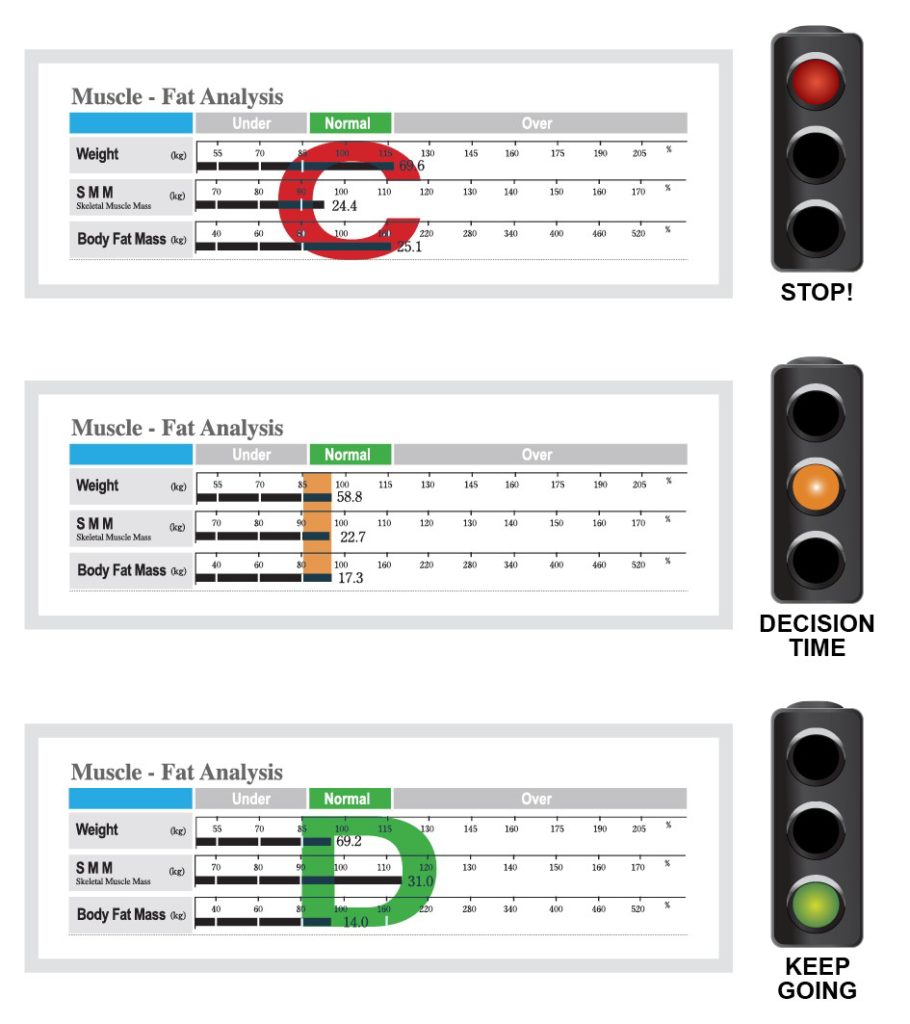
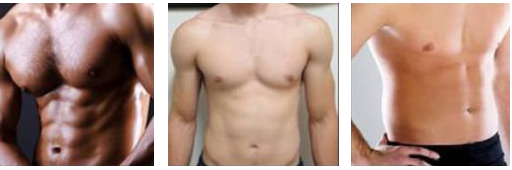
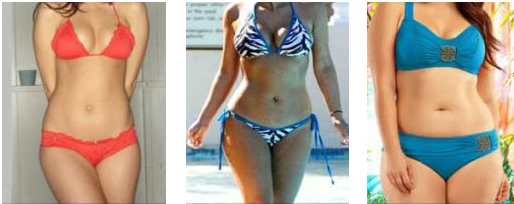
Want to see visual examples of the different ranges of body fat?”

Ā 

Body Water Analysis

ECW Ratio
The ratio of Extracellular Water to Total Body waterĀ is an important indicator as to whether the body water is balanced. If in a healthy state, ECW ratio should be in the range of 0.36 ā€“ 0.39. If the ECW ratio is higher than that range, it may be suggestive of having edemaĀ (swelling of the cell), which may be an indicator that you require a detailed assessment from a healthcare professional.

Body Composition History

Body Composition History
Here you will find the key information of up to 8 previous scans. Previous measurement data is an important indicator to objectify your body composition change. This is very useful when tracking yourself for a transformation challenge.

Ā 

InBody Score / Weight Control

personal trainer in wollongong

The InBody Score is a reflection of the overall evaluation of your body composition. The more muscle mass the body has the higher the score will be and can possibly score over 100 points. Note that very low-fat mass (below healthy ranges) will cause your score to drop.

An average person who is reasonably balanced will generally score between 70-79 points. Higher is considered to be highly active and fit, lower indicates a lack of muscle or may be extremely underweight/overweight.

Ā 

Ā 

Target Weight
Offers a suggestion on what your target weight should be.

Ā 

Weight Control
Suggests how many kilograms to increase or decrease by.

Ā 

Fat Control
Suggests how much fat to increase or decrease for optimal health.

Ā 

Muscle Control
Suggests how much muscle to increase for optimal health.

Segmental Lean Analysis

personal gym trainer wollongong

This section shows us the muscle distribution throughout the body. The body is divided into 5 metrics; left & right arms, trunk and left & right legs. Imbalances between left and right can show us that we have uneven muscle distribution which could be caused by a number of things such as previous or existing injuries, dexterity or favorability.

Ā 

The Upper Bar
The number at the end of the upper bar graph is the amount of soft lean mass in kilograms.

Ā 

The Lower Bar

The lower bar shows you your soft lean mass in percentage. If the graph reaches 100% it means that you have ideal soft lean mass for your weight. The upper bar length is relative to your ideal weight.

Ā 

These metrics can also give us an indicator of which areas of the body require more work to create a balanced muscular development.Ā Ideally, you want to be within 6% of the correlating left or right limb, with any reading above 6% suggesting a reflection of muscle imbalances, which may need addressing with exercise.

Body Balance Evaluation

fitness consultation in wollongong

Body Balance
Focuses on the balance between the upper limbs, the lower limbs and the upper and lower body parts. If there is an imbalance we recommend making changes to your exercise program to increase the muscle mass of the smaller limbs as shown in the Segmental Lean Analysis chart.

Segmental Fat Analysis

best nutritionist in wollongong

Segmental Fat Analysis
This shows us a comparison between the segmental fat analysis and the ideal fat mass in that particular section.

Ideal fat mass is displayed as 100% or less.

Visceral Fat Level

Visceral Fat Level
This is an indicator based on the amount of fat surrounding internal organs in the abdomen. This is of particular importance, because if visceral fat is high then there is a greater possible risk of developing hypertension, diabetesĀ and heart disease. IdeallyĀ it would be suggested to maintain a visceral fat level under 9 to stay in a healthy range.

Additional Data

workout recovery techniques wollongong

Intracellular Water (ICW)
ICW is the water in the cells. Note that as muscles are cells, high muscle mass = high cells = high ICW.

Ā 

Extracellular Water (ECW)

ECW is the water outside the cells. Note that ECW is usually high if ICW is high.

Ā 

Basal Metabolic Rate (BMR)
BMR is the minimum amount of energy required (calories) to sustain vital functions whilst at rest. The higher your muscle mass the higher your BMR will be.

Ā 

Waist ā€“ Hip Ratio (WHR)
WHR is considered a good indicator of internal fat distribution on a person.

Ā 

Visceral Fat Level (VFL)
VFL is an indicator based on the amount of fat surrounding the internal organs in the abdomen. InBody suggests that it is ideal to maintain a visceral fat level under 9 to stay in the more balanced range.

Bone Mineral Content (BMC)

BMC is used in clinical medicine as an indirect indicator of Osteoporosis. A high mineral content generally indicates a higher bone density.

Body Cell Mass (BCM)

BCM is the sum of the cells containing intracellular water and protein found in the organs. The main role of this index is to help evaluate your nutritional state.

Arm Circumference (AC)

AC is the measurement of the left arm.

Arm Muscle Circumference (AMC)

AMC is the measurement of the arm minus the fat. Excessive fat in this area may be suggestive of hormonal imbalances.

found my physique
ENROLLMENT OPEN

Make a Transformation: Nutrition Coaching

It's finally here! Personalised Nutrition. Nutrition Software. Regularly Check-ins. Video Based Education

Learn More
x Snap Challenge
Online / Local

Personalised Nutrition Plans for Gyms & PTs

Want to achieve better results with your clients? FMP works with gyms and trainers by providing nutrition plans

Learn More